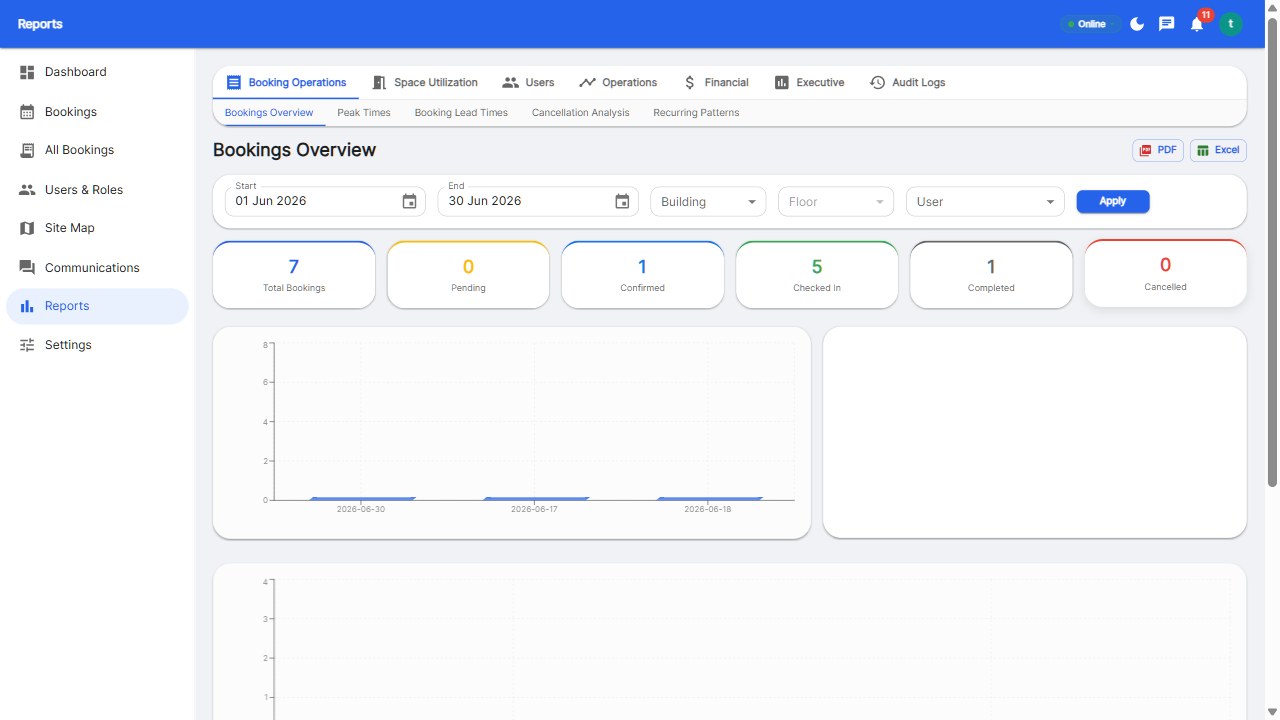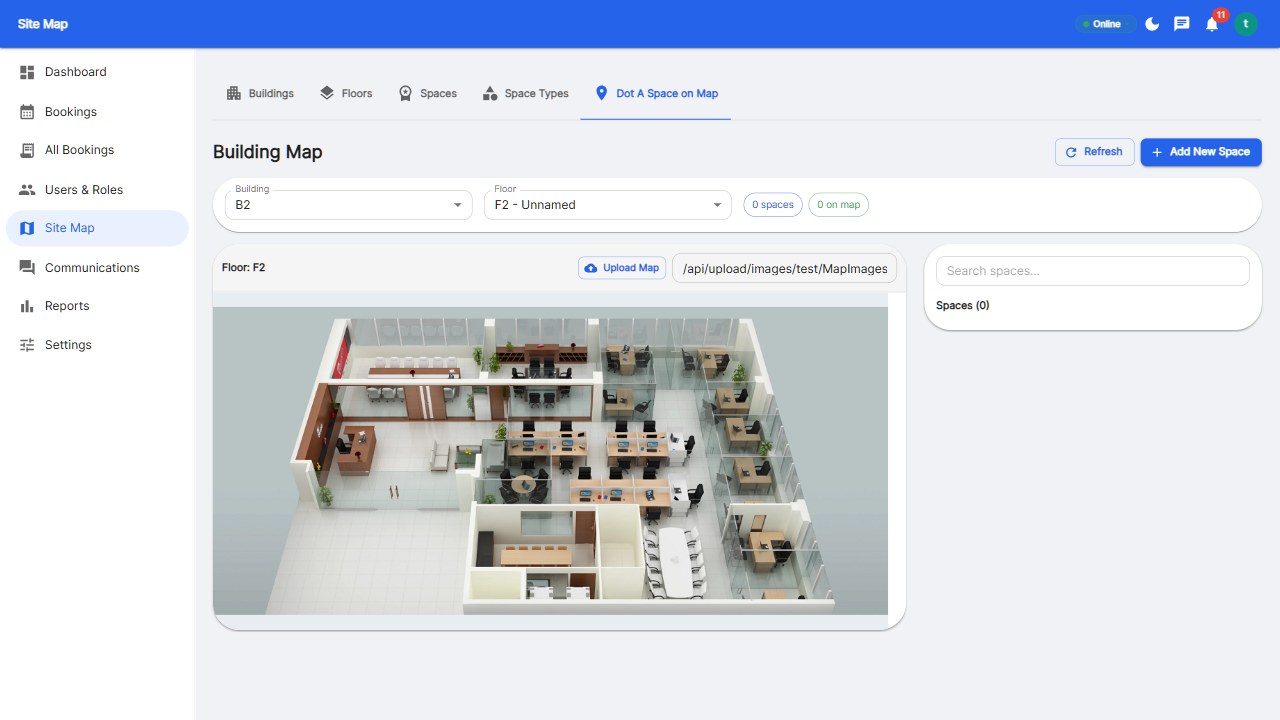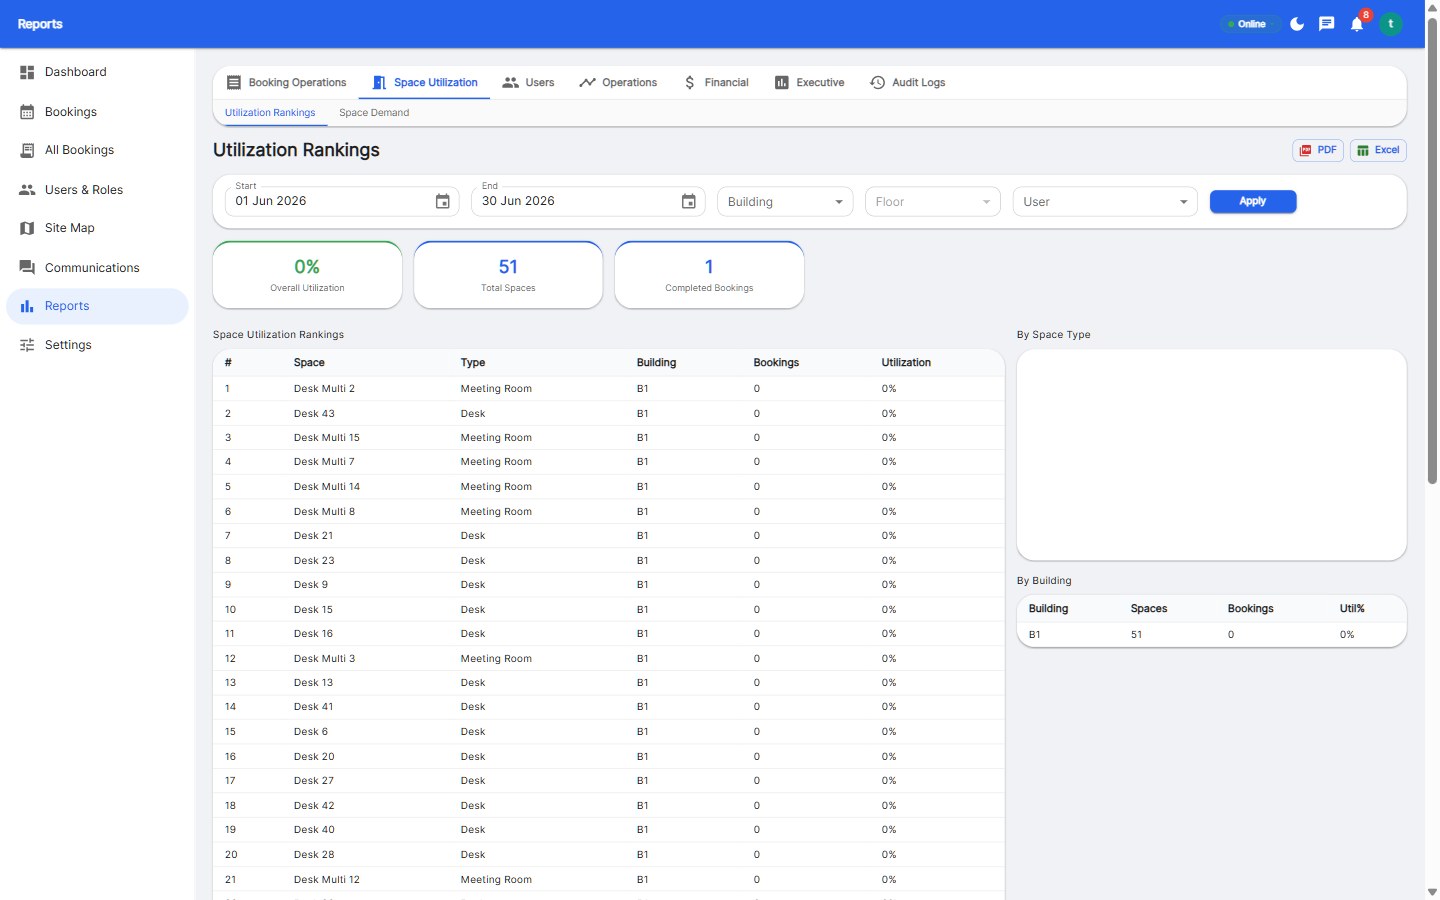
The 2026 Hybrid Office Benchmark is a reference dataset for workplace leaders: utilization ranges, no-show rates, anchor-day patterns, booking behavior, and the space savings that data-driven management unlocks. It aggregates patterns observed across Reservete's 1.2M+ desk bookings and 10K+ active users in 15+ countries, plus published industry ranges. Use it to benchmark your own office - your booking analytics are the best input, and these figures tell you whether your numbers are healthy.
| Metric | 2026 benchmark | Healthy range |
|---|---|---|
| Average desk utilization (hybrid) | 45-55% | 50-70% |
| Peak utilization on anchor days | 70-85% | 75-90% |
| Friday utilization vs peak | 30-50% of peak | n/a |
| Offices over-providing space | 30-40% | n/a |
| Space consolidatable with data | 20-30% | n/a |
Read: utilization below 40% at peak signals surplus space; sustained 90%+ signals a shortage and booking friction. Most hybrid offices carry 20-30% consolidatable space.
| Metric | Without enforcement | With check-in enforcement |
|---|---|---|
| No-show rate | 15-25% | Under 10% |
| Recovery in first month | n/a | ~50% drop |
Read: no-shows are the fastest win in workspace management - a configuration change (check-in windows, grace periods, auto-release) recovers up to a quarter of bookable capacity at zero cost.
| Pattern | Benchmark |
|---|---|
| Optimal anchor days per week | 2-3, clustered Tuesday-Thursday |
| Anchor-day booking volume vs flexible days | 2-3x |
| Mobile share of bookings | 60-75% |
| Bookings made 1-3 days ahead | Majority |
| Recurring bookings share | 20-30% |
Read: anchor days concentrate demand, which is exactly why capacity must be planned for the peak day - not the weekly average - and why booking software is the standard tool for hybrid offices.
| Metric | Benchmark |
|---|---|
| Real estate share of occupancy cost | 25-35% |
| Unused desk cost (major cities) | $1,000-$1,500/month |
| Energy savings per desk (occupancy-based) | ~$120/year |
| Productivity recovered per employee | ~2 hours/week |
| Utilization improvement after adoption | 25-40% |
| Software payback period | Under 30 days |
Read: the economics compound: consolidation saves rent, enforcement saves capacity, energy optimization saves utilities, and recovered employee time is the largest soft-dollar line.
Benchmark your own numbers against these ranges in three steps. First, pull your booking and check-in analytics for the last 30 days. Second, compare each metric to the ranges above and flag outliers. Third, act on the biggest gap first: no-shows above 15% get check-in enforcement; utilization under 40% triggers a consolidation review; Friday-heavy emptiness suggests zone-level closures.
Your own data is the most reliable input - these benchmarks are guardrails to tell you whether your numbers are healthy, not substitutes for your analytics. Model the financial impact with the Reservete ROI calculator.
50-70% average utilization is healthy for hybrid offices, with 70-85% peaks on anchor days. Below 40% signals surplus space; sustained 90%+ signals a shortage.
15-25% without check-in enforcement, dropping below 10% within a month of configuring check-in windows, grace periods, and auto-release.
20-30% on average, using booking data to close underused floors and zones. The savings grow as check-in enforcement matures.
They aggregate observed patterns across Reservete's 1.2M+ bookings and 10K+ active users, cross-checked against published industry ranges. Use them as guardrails; your own analytics remain the primary input.
Your booking platform's analytics reports - utilization, no-shows, peaks, and compliance - generate all of these metrics automatically from check-in data.
Benchmark your office against real numbers.
Start your free 30-day trial at Reservete.com - no credit card required, full access to every feature.

Enterprise workspace management platform. Book desks, meeting rooms, and parking spots in seconds.
Get product updates and workspace tips.