The five office space utilization metrics that matter are: occupancy rate (desks used vs available), utilization rate (booked vs bookable), no-show rate, peak-time patterns, and cost per used desk. Track them monthly with booking analytics to right-size your portfolio - most offices can cut 20-30% of space with data they already generate.
Occupancy asks 'is anyone there?' - heads in seats, from check-in data. Utilization asks 'is it being used?' - booked and checked-in desks as a share of bookable. Occupancy overestimates need (people present but desks idle); utilization underestimates demand during peaks. Track both, and report them separately.
The classic error is reporting one number as 'usage.' A floor can show 80% occupancy on a busy Tuesday while running 40% utilization across the week - and the two numbers justify different decisions entirely.
| Metric | Definition | Healthy range |
|---|---|---|
| Occupancy rate | Desks in use / desks available | 70-85% at peak |
| Utilization rate | Desks booked & checked in / bookable | 60-80% |
| No-show rate | Bookings with no check-in / total bookings | Under 10% |
| Peak patterns | Usage by hour, day, floor | Anchors at 80%+, Fridays low |
| Cost per used desk | Annual space cost / desks actually used | Trend down quarterly |
Healthy ranges are benchmarks, not targets. Your office's right numbers depend on lease terms, recruiting plans, and anchor-day policy - the point of the metrics is trend, not absolute value.
Each metric maps to a decision: occupancy below 60% at peak suggests consolidation; no-shows above 15% demand stricter check-in rules; peak patterns reveal which floors to close on light days. Facility managers who report these five numbers monthly turn the real estate review from opinion into optimization.
Build the monthly rhythm: pull the numbers on day 2, review with facilities on day 3, and file a one-page note for the quarterly portfolio review. Consistency beats sophistication - a boring monthly report beats a brilliant annual one.
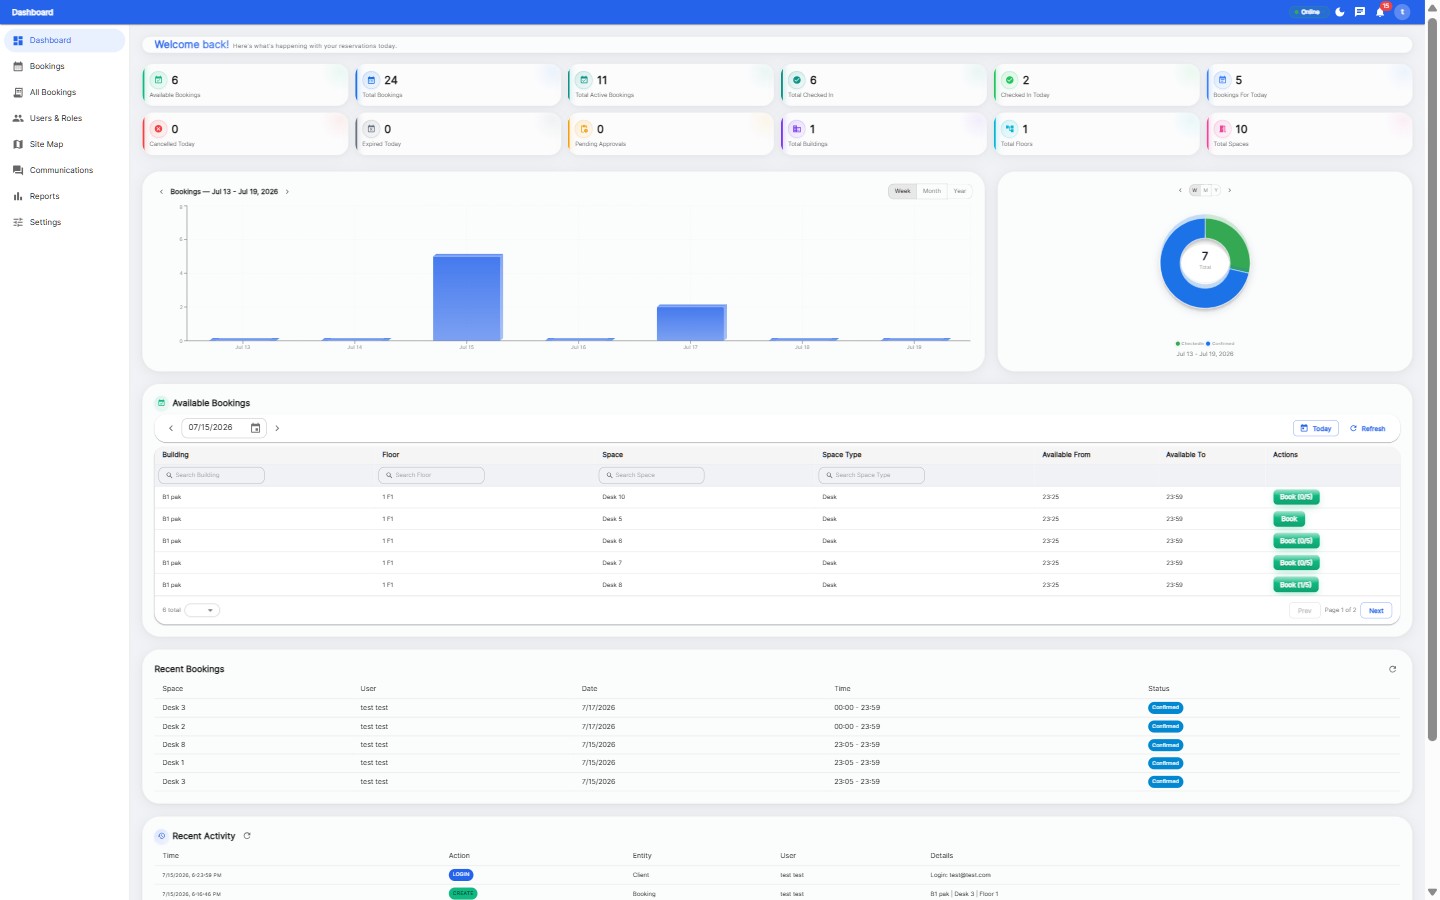
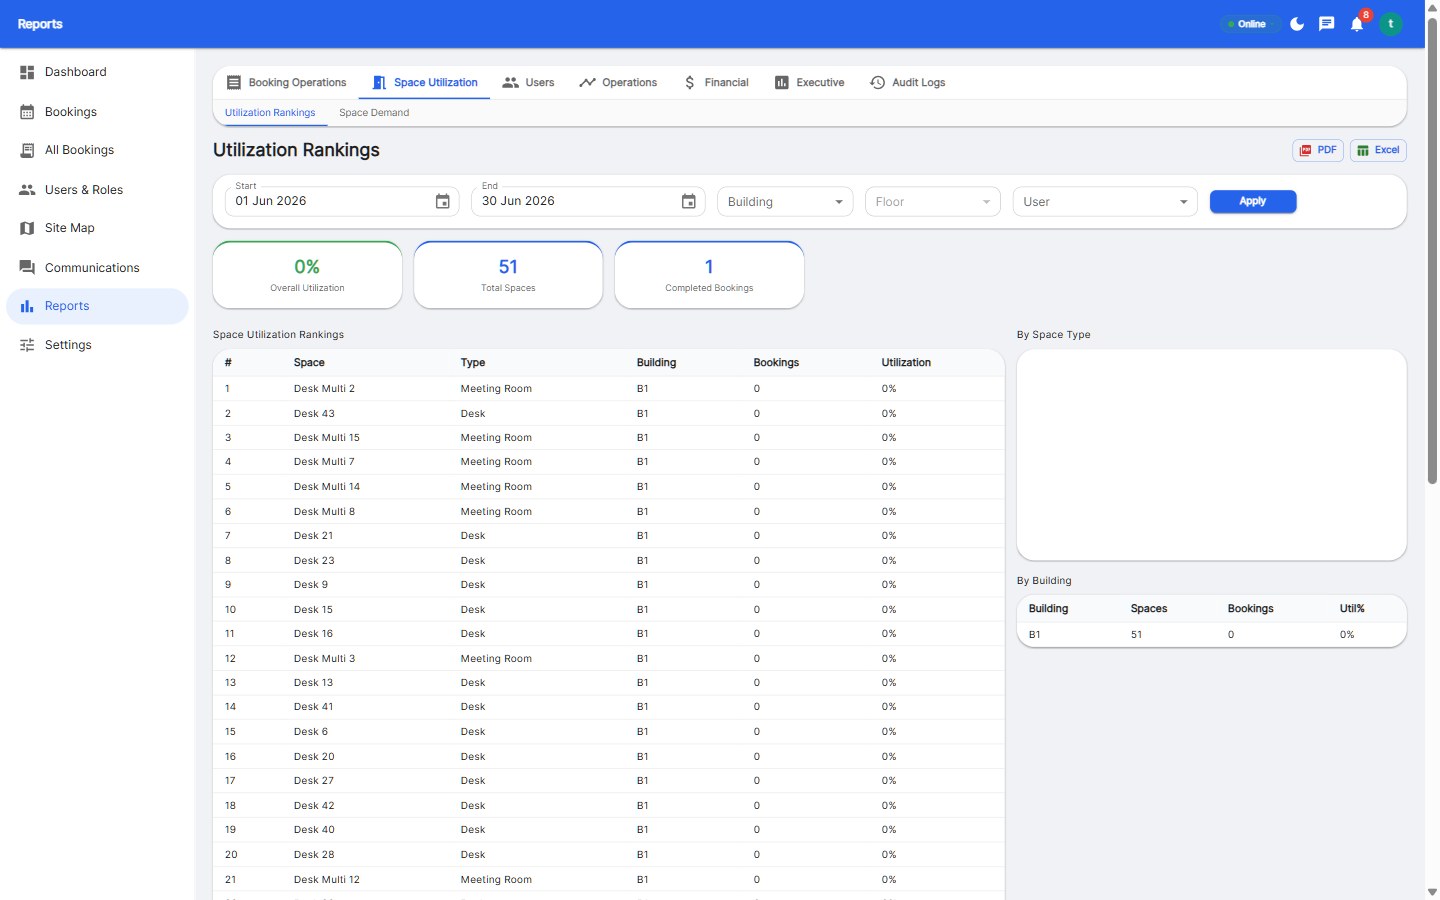
Booking and check-in platforms generate all five metrics automatically. Reservete's utilization reports cover occupancy, peak times, no-shows, and per-space rankings with exportable charts - no sensors, no cameras, no spreadsheets.
If you are currently building these numbers from badge data or manual counts, the upgrade is not just accuracy - it is timeliness. Booking platforms give you today's numbers this afternoon; legacy methods give you last quarter's numbers next month.
Occupancy counts bodies (check-ins), utilization counts productive desk use (booked and used). Both matter: occupancy drives capacity planning; utilization drives efficiency decisions.
60-80% utilization at peak is healthy for hybrid offices. Below 50% signals surplus space; sustained 90%+ signals a shortage and booking friction.
From the booking system: booked-and-checked-in desks divided by bookable desks. It is accurate, privacy-friendly, and free - no hardware required.
Monthly at minimum. The five core metrics take minutes to pull from booking analytics and keep your portfolio decisions current with real usage patterns.
Generate every metric from one platform.
Start your free 30-day trial at Reservete.com - no credit card required, full access to every feature.

Enterprise workspace management platform. Book desks, meeting rooms, and parking spots in seconds.
Get product updates and workspace tips.