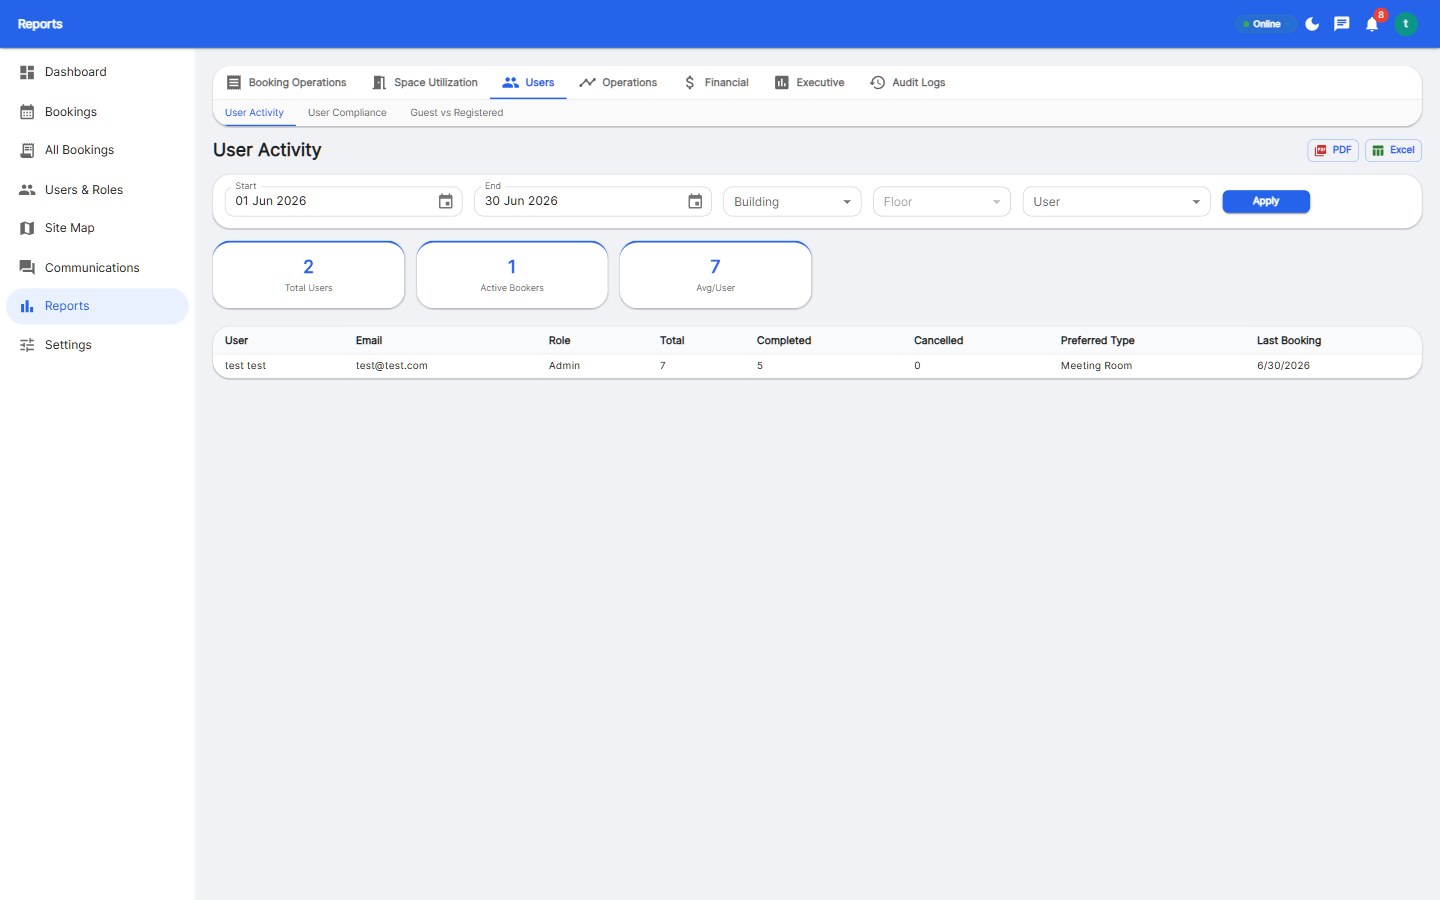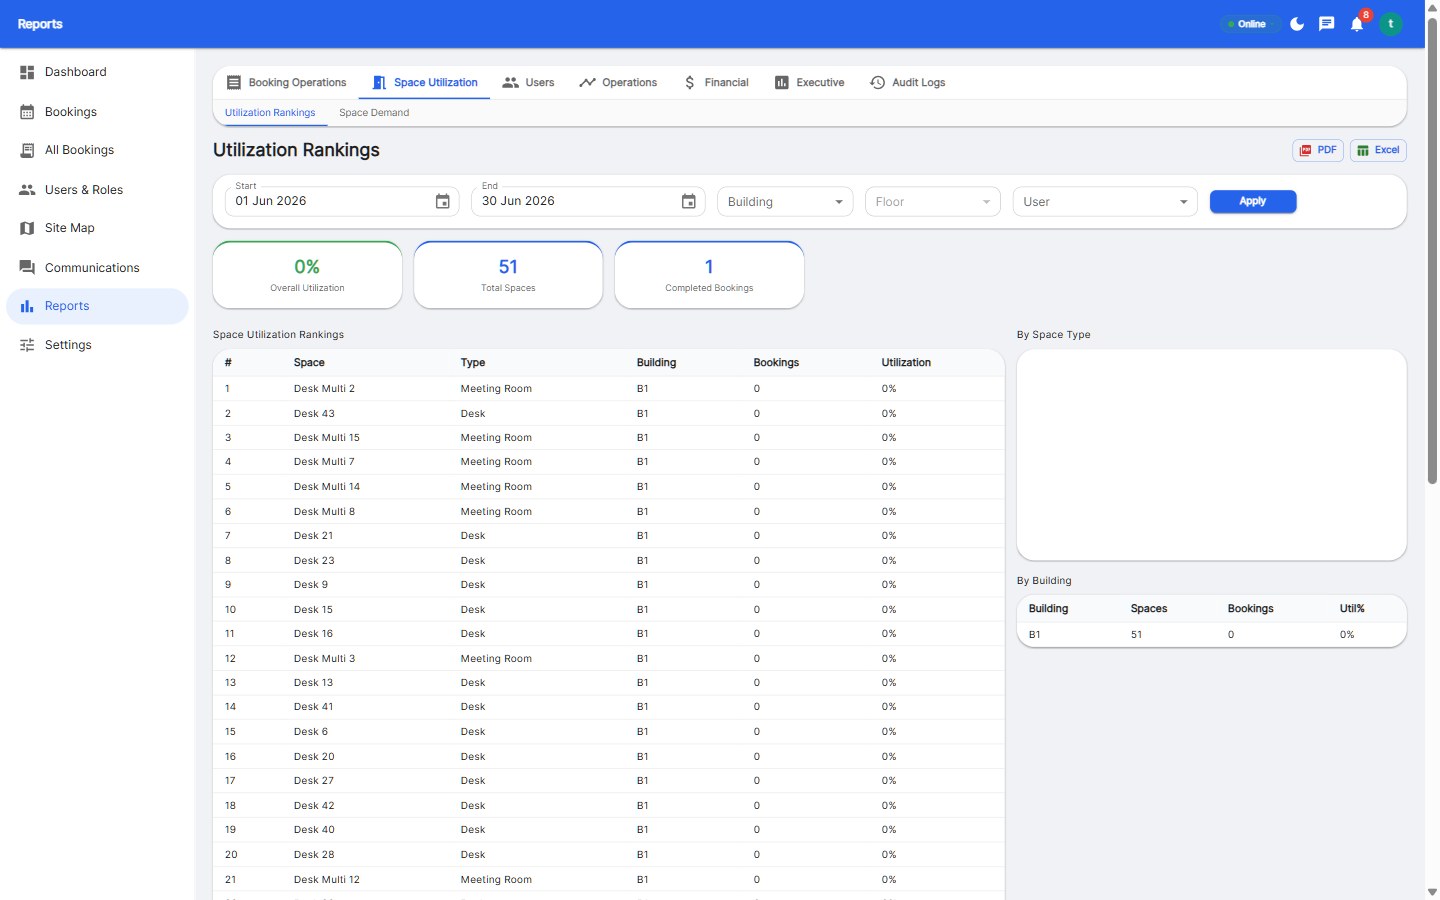
The 8 workplace analytics reports facility teams should run monthly: utilization by space, occupancy by floor/day, no-show rate, peak times, user compliance (check-in %), booking lead time, cancellation rate, and cost per used desk. Run them monthly, trend them quarterly, and let them drive consolidation and policy decisions.
| Report | Answers |
|---|---|
| Utilization by space | Which desks/rooms earn their keep? |
| Occupancy by floor/day | Where and when is the office full or empty? |
| No-show rate | How much capacity leaks to ghosts? |
| Peak times | Which hours drive capacity needs? |
| Check-in compliance | Which teams follow the rules? |
| Booking lead time | Do people book ahead or at the door? |
| Cancellation rate | Is inventory churning? |
| Cost per used desk | What does usable space really cost? |
Pull reports on day 2 of the month, review with facilities on day 3, file a one-page note for the quarterly portfolio review. Consistency beats sophistication - and the trend lines matter more than any single month.
Booking platforms generate all eight automatically. Reservete's analytics cover operations, utilization, users, peaks, cancellations, and comparisons with PDF/Excel export - the full monthly packet in a few clicks.
The practice of measuring how office space is used - utilization, occupancy, no-shows, peaks - to drive capacity, cost, and policy decisions.
Monthly at minimum, with quarterly trends for portfolio decisions. Booking platforms make both trivial to generate.
Utilization by space, occupancy by floor/day, no-show rate, and cost per used desk are the core four - the rest refine them.
Run all eight reports in a few clicks.
Start your free 30-day trial at Reservete.com - no credit card required, full access to every feature.

Enterprise workspace management platform. Book desks, meeting rooms, and parking spots in seconds.
Get product updates and workspace tips.