Reservete
Reservete
Back to Blog
space utilization data
facility management
office cost reduction

How Facility Managers Use Space Utilization Data to Cut Office Costs

Sara

Head of Sales, Reservete
|
Published Monday, September 21, 2026Updated September 21, 2026
How Facility Managers Use Space Utilization Data to Cut Office Costs
How facility managers turn desk and room utilization data into real cost savings: which metrics to track, how to read them, and the consolidation decisions they support.

The shift from instinct to instrumentation

Space utilization data turns facility management from a reactive job into a measurable one. Instead of arguing about whether the office feels full, facility teams can point to desk-level occupancy, peak-day demand and no-show rates, and make decisions that hold up in a budget review.

In a hybrid office, intuition is actively misleading. Corridors feel busy at 10am on a Tuesday and deserted on a Friday, and both impressions can be true while average utilization sits at 45%. Data separates the peak from the pattern.

The five metrics that actually change decisions

  1. Average daily utilization by floor and building. The headline number, but never the whole story.
  2. Peak-day utilization. The real constraint. If Tuesday runs at 78%, that — not the 45% average — determines how much space you need.
  3. No-show rate. Bookings that were never used. High no-shows hide genuine demand and inflate your apparent capacity.
  4. Meeting room utilization by size. Rooms are usually the scarcest resource, and large rooms are frequently over-provisioned.
  5. Attendance by team. Shows which groups genuinely need dedicated zones and which can share.

From numbers to savings: the three levers

1. Consolidate underused floors

If a floor averages below 40% utilization and peak demand can be absorbed by adjacent floors, it is a candidacy for closure or sublet. At around $18,000 per desk per year, a 100-desk floor represents roughly $1.8 million in annual cost.

2. Rebalance desk ratios

Moving from a 1:1 ratio to 0.7 desks per employee requires data to defend it. Peak-day utilization is the evidence that convinces leadership and reassures employees that they will still get a seat.

3. Right-size meeting rooms

Converting rarely used large rooms into two smaller huddle rooms usually improves availability more than adding floor space, at a fraction of the cost.

Building the reporting rhythm

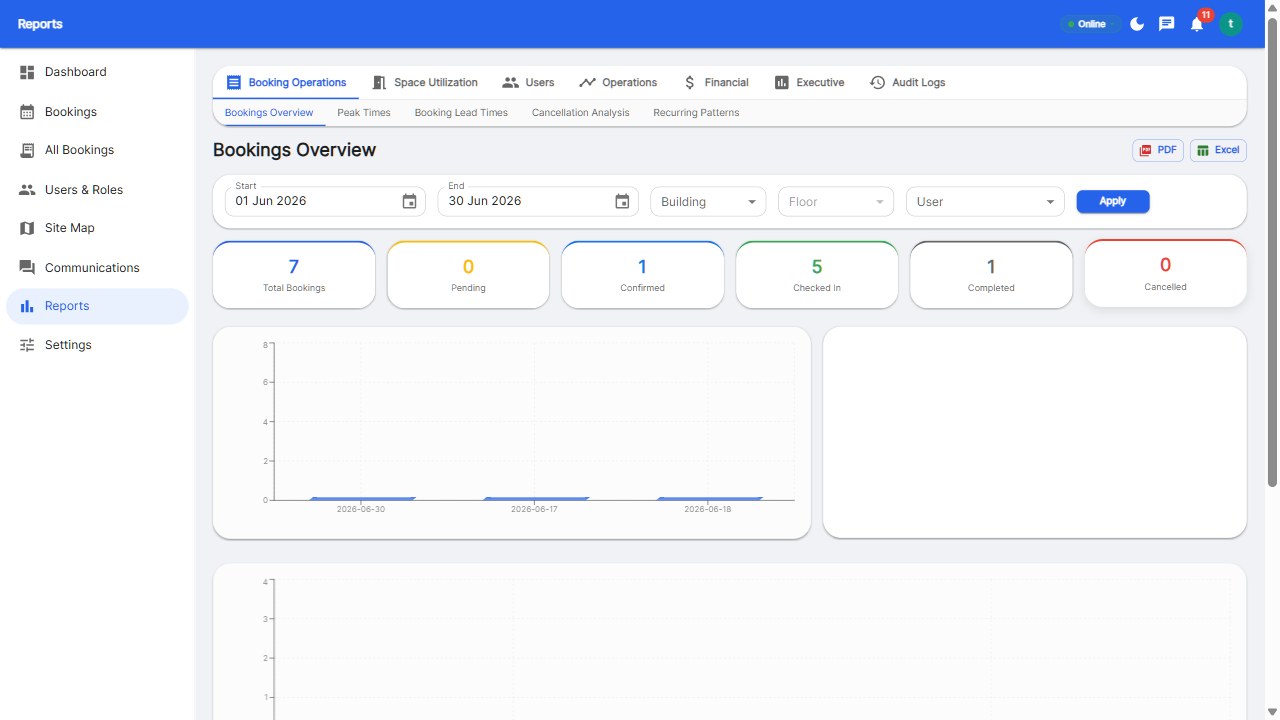
  • Weekly: peak-day utilization and no-show rate, shared with team leads. Short, operational, behaviour-shaping.
  • Monthly: floor-level utilization, room booking by size, and cost per occupied desk. This is the management view.
  • Quarterly: space strategy review — consolidation candidates, lease decisions, and capital projects.

Cost per occupied desk is the single most useful executive metric: it exposes the true cost of empty space and trends directly as utilization improves.

Common analysis mistakes

  1. Averaging across a week. It hides the peak that determines capacity.
  2. Trusting badge data alone. Badges do not capture space type or no-shows.
  3. Ignoring no-shows. They understate real demand and mislead consolidation decisions.
  4. Measuring once. Utilization drifts with policy changes and hiring; the rhythm matters as much as the metric.

Getting started

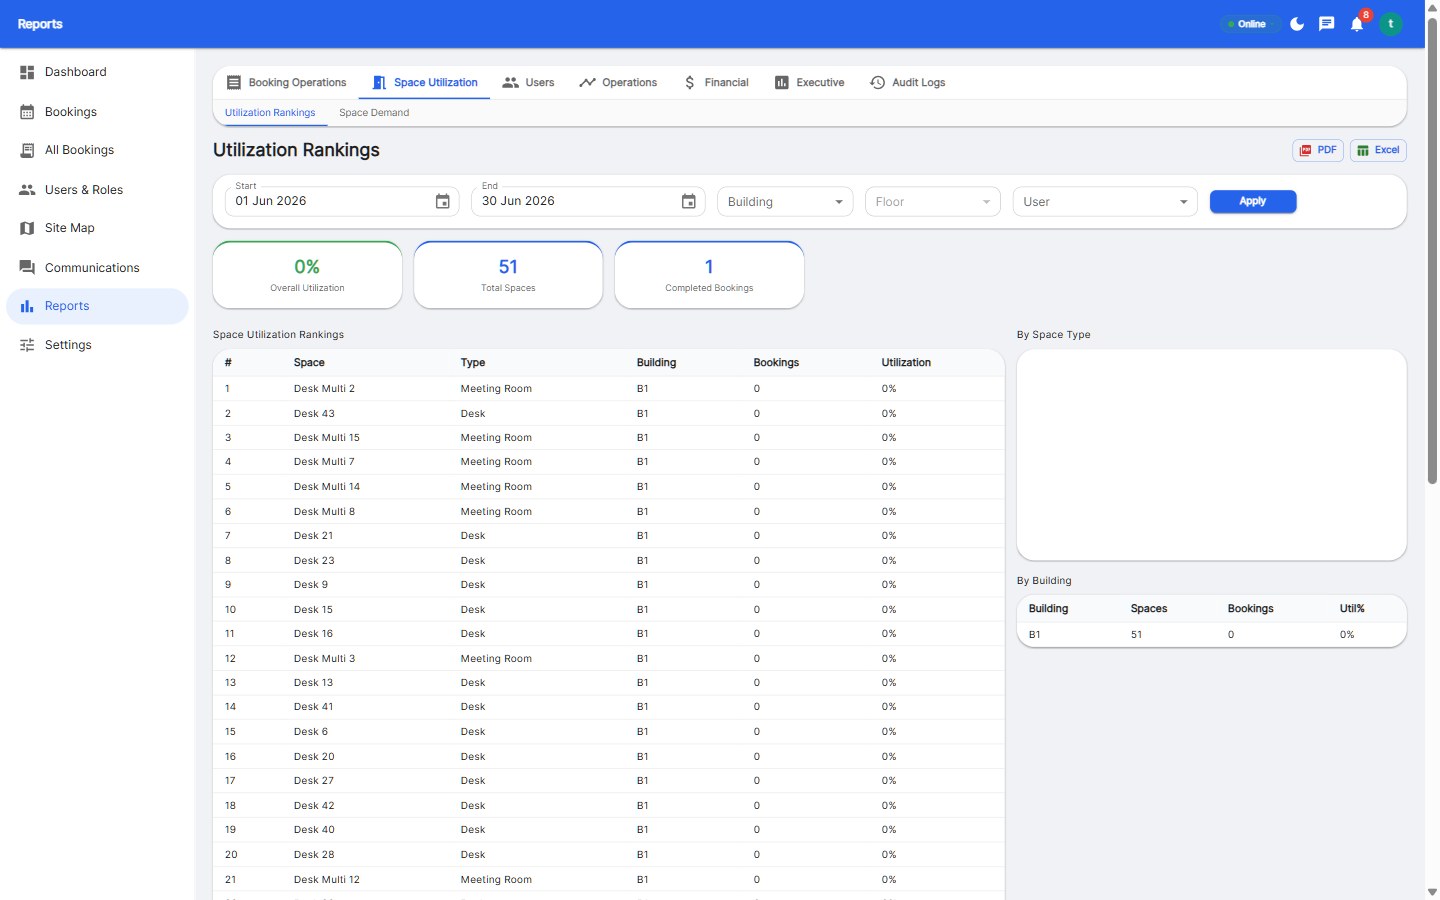
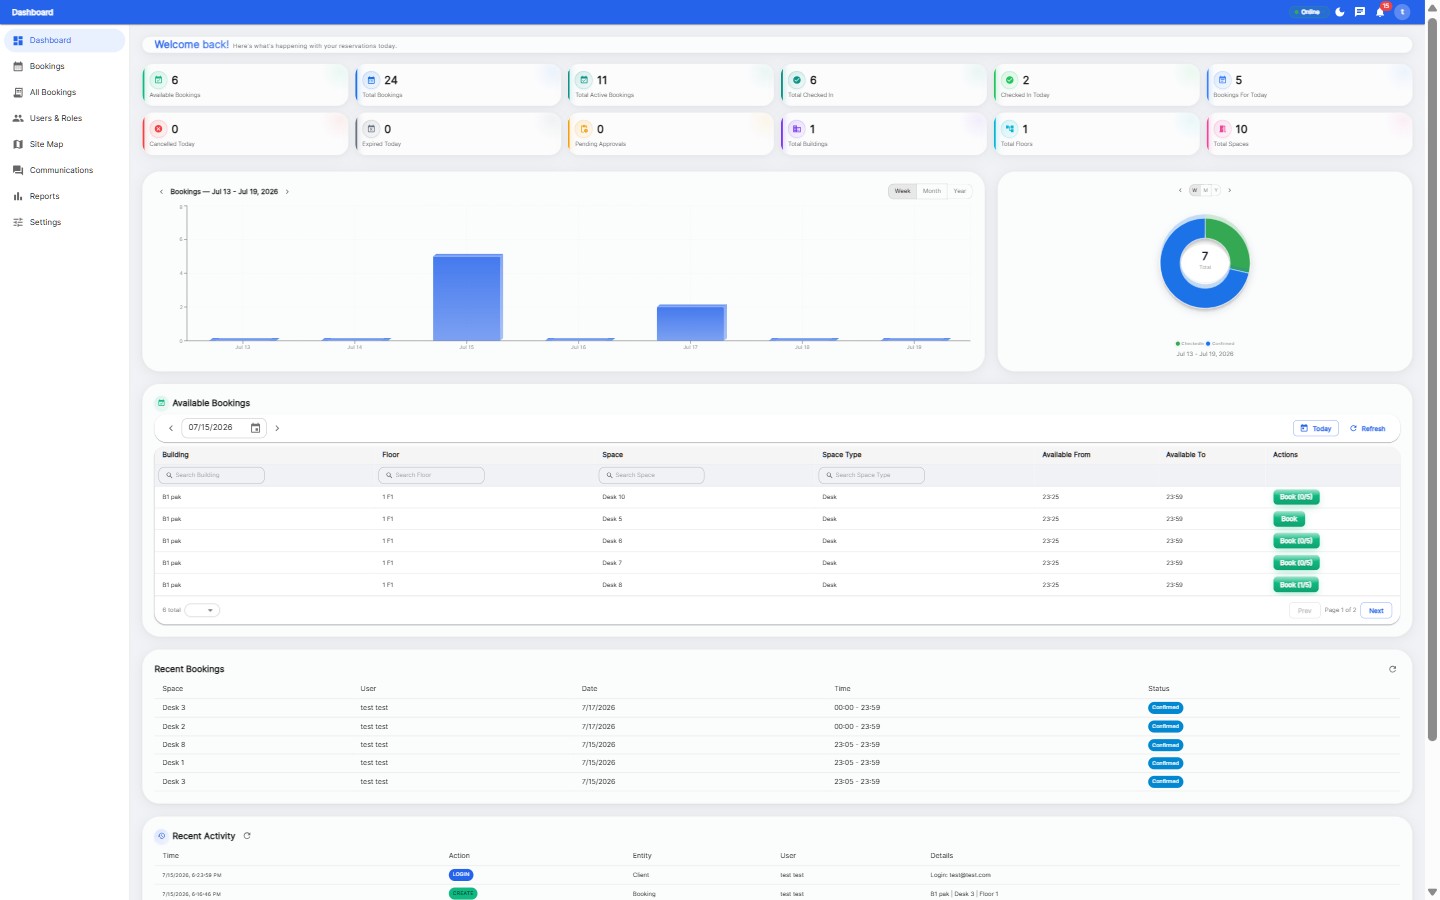
You do not need a data team — you need a booking system that records who booked what, where, and whether they turned up. That alone produces desk-level utilization, no-show rates and room statistics. Most teams have a defensible baseline within a month of switching on desk and room booking, and can model the savings with our ROI calculator. For benchmark ranges, see our 2026 hybrid office benchmark report.

Frequently asked questions

What is a good space utilization rate?

Hybrid offices typically average 40–55% desk utilization. A healthy target after optimization is 60–75%: high enough to justify the space, low enough to absorb peak days without shortage.

How do I measure utilization without sensors?

Booking data with check-in gives you bookable-space utilization without any hardware. Sensors add accuracy for unbooked areas, but they are not required to make consolidation decisions.

How often should utilization be reviewed?

Weekly for operational behaviour, monthly for management reporting, and quarterly for space strategy and lease decisions.

Can utilization data really cut costs?

Yes, primarily by avoiding or removing leased space. When 25% of desks are unused, consolidating them is one of the largest controllable savings available to most companies.

space utilization data
facility management
office cost reduction
Back to Blog

Related Articles

Reservete
Reservete

Enterprise workspace management platform. Book desks, meeting rooms, and parking spots in seconds.

Product

Features

Pricing

Compare

ROI Calculator

Stay up to date

Get product updates and workspace tips.

© 2026 Reservete. All rights reserved.